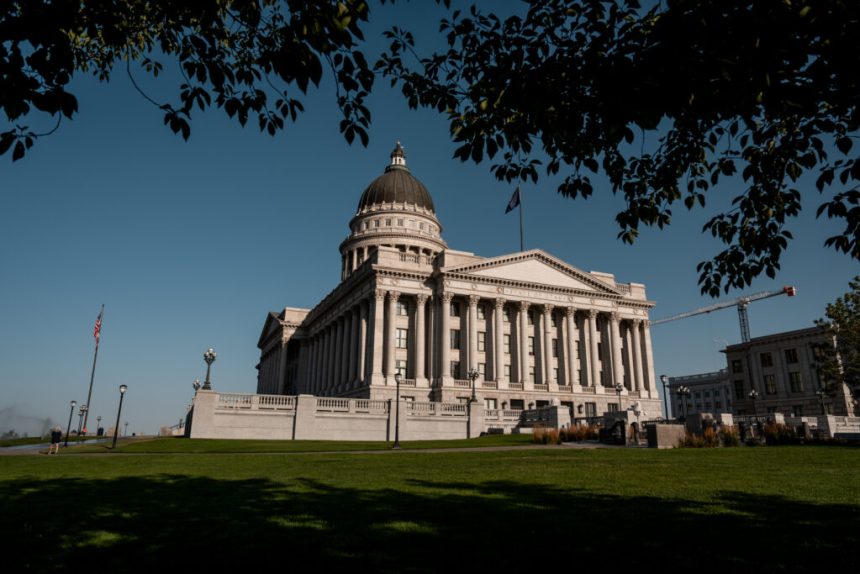
The Capitol in Salt Lake City is pictured on Thursday, July 10, 2025. (Photo by Spenser Heaps for Utah News Dispatch)
Next Monday, the Republican-controlled Utah Legislature is expected to convene for a special session to vote on a proposed congressional map to submit to a judge for consideration in the state’s court-ordered redistricting process currently underway.
Third District Judge Dianna Gibson will ultimately decide which congressional map will remedy the 2021 boundaries that she ruled last month were a product of an unconstitutional process after Utah lawmakers that year repealed and replaced Better Boundaries’ voter-approved ballot initiative, known as Proposition 4, that sought to create an independent redistricting process.
But the judge has also given lawmakers an opportunity to propose a preferred map. While the state’s Republican supermajority is abiding by court orders “under protest,” state lawyers continue to fight the ruling by appealing to the Utah Supreme Court and possibly the U.S. Supreme Court.
In the meantime, though, Utahns have an opportunity to weigh in on Utah’s unique mid-decade redistricting process — during a time when redistricting fights are unfolding across the nation as President Donald Trump ups the pressure on states to bolster Republicans’ slim majority during the 2026 midterms.
Unlike other states, however, a judge has ordered Utah’s mid-decade redistricting process with the aim of remedying lawmakers’ watering down of an independent redistricting commission about six years ago, turning it into an advisory body that legislators could ultimately ignore when they adopted the 2021 congressional map that, up until now, has guided elections.
Since the adoption of that 2021 congressional map, Republicans have easily dominated all four of Utah’s U.S. House seats. Now, depending on the map Gibson chooses (either one drawn by lawmakers or by the plaintiffs in the redistricting lawsuit that continues to make its way through the courts) Democrats may have a more competitive chance in at least one district.
Last week, the newly convened Legislative Redistricting Committee held two public hearings as it weighed a set of maps. Five maps were drawn by Republicans’ retained redistricting expert Sean Trende, a senior elections analyst for RealClearPolitics, and Democrats’ preferred map was drawn by their hired expert, Daniel Magleby, a professor at SUNY Binghamton in New York.
How to weigh in
Through the Utah Legislative Redistricting Committee’s website, Utahns can not only post public comments on each of the proposed maps, but also view other map proposals and submit their own.
The website includes instructions on how to comment on a map. Here’s a direct link to the dozens of proposed congressional maps that have been submitted since lawmakers began taking 2025 submissions starting Sept. 17.
However, even though the website has been accepting and posting public map submissions, leaders of the Legislative Redistricting Committee indicated last week they’d be reluctant to consider a map submitted by the public.
Last week, a Utahn, James Carter, urged lawmakers to reject all six of their proposed maps and instead pick one drawn by a member of the public. But the committee’s co-chair Scott Sandall, R-Tremonton, indicated he would have reservations with doing that, saying it’s “impossible to ascertain amongst all the maps that were drawn and submitted if any of them were drawn using political data in the timeframe that we have.”
“It’s almost an impossible task,” Sandall said. “Because that is our mandate under Prop 4, no political consideration can be made in drawing a map. And we would have to go in and depose any or all of the map drawers to find out if political data was used, and we just don’t have that time.”
Nonprofit releases map scorecard
The Better Utah Institute — a nonpartisan nonprofit that that is related to the progressive advocacy group Alliance for a Better Utah — released on Monday an analysis of the six proposed congressional maps being considered by the Legislative Redistricting Committee, with an aim of informing the public during the public comment period that ends Oct. 5, the day before the special session.
The Better Utah Institute said it scored the proposed congressional maps using these five measures: “city and county splits, compactness, competitiveness, and proportionality.”
SUBSCRIBE: GET THE MORNING HEADLINES DELIVERED TO YOUR INBOX
“These standards matter because they show whether maps serve people or politicians,” the Better Utah analysis says. “Splitting cities and counties silences local voices. Compactness reveals when districts are carved up to protect incumbents or punish parties. Competitiveness ensures voters, not one party, decide elections. Proportionality shows whether results reflect the real balance of political views in Utah.”
The lower the scores for city and county splits, the better, based on Proposition 4’s standards. And higher scores for compactness, competitiveness and proportionality mean a better score for a map.
“We’re doing this because redistricting decides whose voices count in Congress for the next five years,” the Better Utah Institute said. “When maps are drawn fairly, every community gets a seat at the table. When they’re rigged, people lose trust in government itself. These scores pull back the curtain so Utahns can see clearly whether the maps on the table strengthen our democracy or weaken it.”
Proposition 4’s standards lay out the following criteria, in order of importance:
-
Contiguity and ease of transportation
-
Preserve traditional neighborhoods and communities of interest
-
Follow natural and geographic boundaries
-
Maximize boundary agreement
According to the analysis, while Democrats’ preferred map — named after Senate Minority Leader Luz Escamilla, D-Salt Lake City, and Rep. Doug Owens, D-Millcreek, the only two Democrats on the legislative committee — had the biggest number of city and county splits compared to the other legislative maps, theirs scored the highest in the Better Utah Institute’s analysis for the other principles of compactness, competitiveness and proportionality.
Out of the other legislative maps, Option B scored the next highest for compactness, competitiveness and proportionality with only six city and county splits.
Here’s the full analysis with the scores for each map broken down: